Moore Park Sales Statistics for April 2018
Sales Volume Changes*
All homes - up 20.5% to 47
Detached - up 17.6% to 40
Semi-detached - up 25% to 5
Dollar Value Changes*
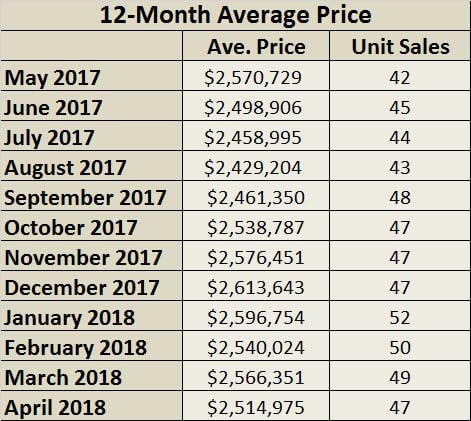
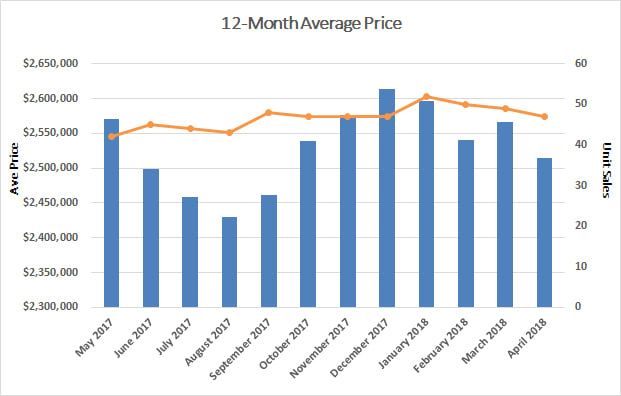
All homes - down 0.4% to $2,514,975
Detached - up 4.2% to $2,673,820
Semi-detached - up 2.3% to $1,591,200
*MLS 12-month year-over-year changes ending April 30, 2018; Provided by Jethro Seymour
As of May 1st, 2018, there are 5 homes available in the Moore Park (part of C09) area, ranging in price from $1,788,000 (54 days on the market) for a semi-detached on Moore Avenue to $3,988,000 (36 days on the market) for a detached home on Glenrose Avenue.
In April, 7 homes sold in Moore Park, 6 of those were detached. The average time to sell a home was 4 days, three homes were sold a day after those were listed while the longest lasted 9 days. This doesn't include the 3 homes that have been listed for more than 30 days or the 3 homes that were listed in the month of April and are not selling at their current listed prices.
Six of the 7 April home sales sold above their listed price. The highest selling home was a detached 4-bedroom, 5-bathroom home on a 37.5 x 150-foot lot, with a double private drive and garage. It sold for $4,800,000 or 114% of the asking price on Welland Avenue and was followed by a home in on Hudson Drive which sold for $3,850,000. Both were well-appointed homes.
Entry into the Moore Park market now requires buyers to spend over $1,100,000 dollars. The average sale price over the last 16 months (January 1, 2017 to April 30, 2018) has been $2,619,446 and those homes averaged 5% above their asking prices. 2017 was a much busier year, 9 homes sold last April averaging 15% above their asking prices.
Low inventory will continue to drive sales through May and into June. All 5 banks recently raised their posted rates which will have an effect on new entrants into the buying market and will add downward pressure on prices should inventory increase further.
Consider me your Moore Park neighbourhood real estate expert and resource. When it is time to move, I am here to help with insightful strategies, expert negotiation skills and results-focused marketing plans.
View home sales statistics for March 2018 here.
April Sales in Moore Park
| Detached | No. of Sold | Avg. Price | % of List Price | Days on Market |
| 2 Bedroom | 1 | $1,570,000 | 105 | 6 |
| 3 Bedroom | 2 | $2,637,500 | 102 | 4 |
| 4 Bedroom | 2 | $3,590,000 | 117 | 1 |
| 6 Bedroom | 1 | $3,830,000 | 97 | 9 |
| Semi-detached | No. of Sold | Avg. Price | % of List Price | Days on Market |
| 4 Bedroom | 1 | $2,500,000 | 109 | 7 |
Source: TREB MLS Sales Data as of May 1, 2018
Statistics Provided by Jethro Seymour, Broker & MCNE
Jethro Seymour, one of the Top Davisville Village Real Estate Brokers at Royal LePage RES Ltd., Johnston & Daniel Division.
Jethro is a midtown Toronto residential specialist with over 20 years of sales experience in real estate, marketing, construction and publishing. He has helped many families find homes in Toronto’s great neighbourhoods, and has extensive knowledge of local markets, new home construction, resale home sales, and the condo market. Living in midtown Toronto, Jethro previews many of the homes that come to market for his clients and inventory knowledge. Jethro specializes in Moore Park, Davisville Village, Leaside and Midtown Toronto neighbourhoods.


